Context and overview
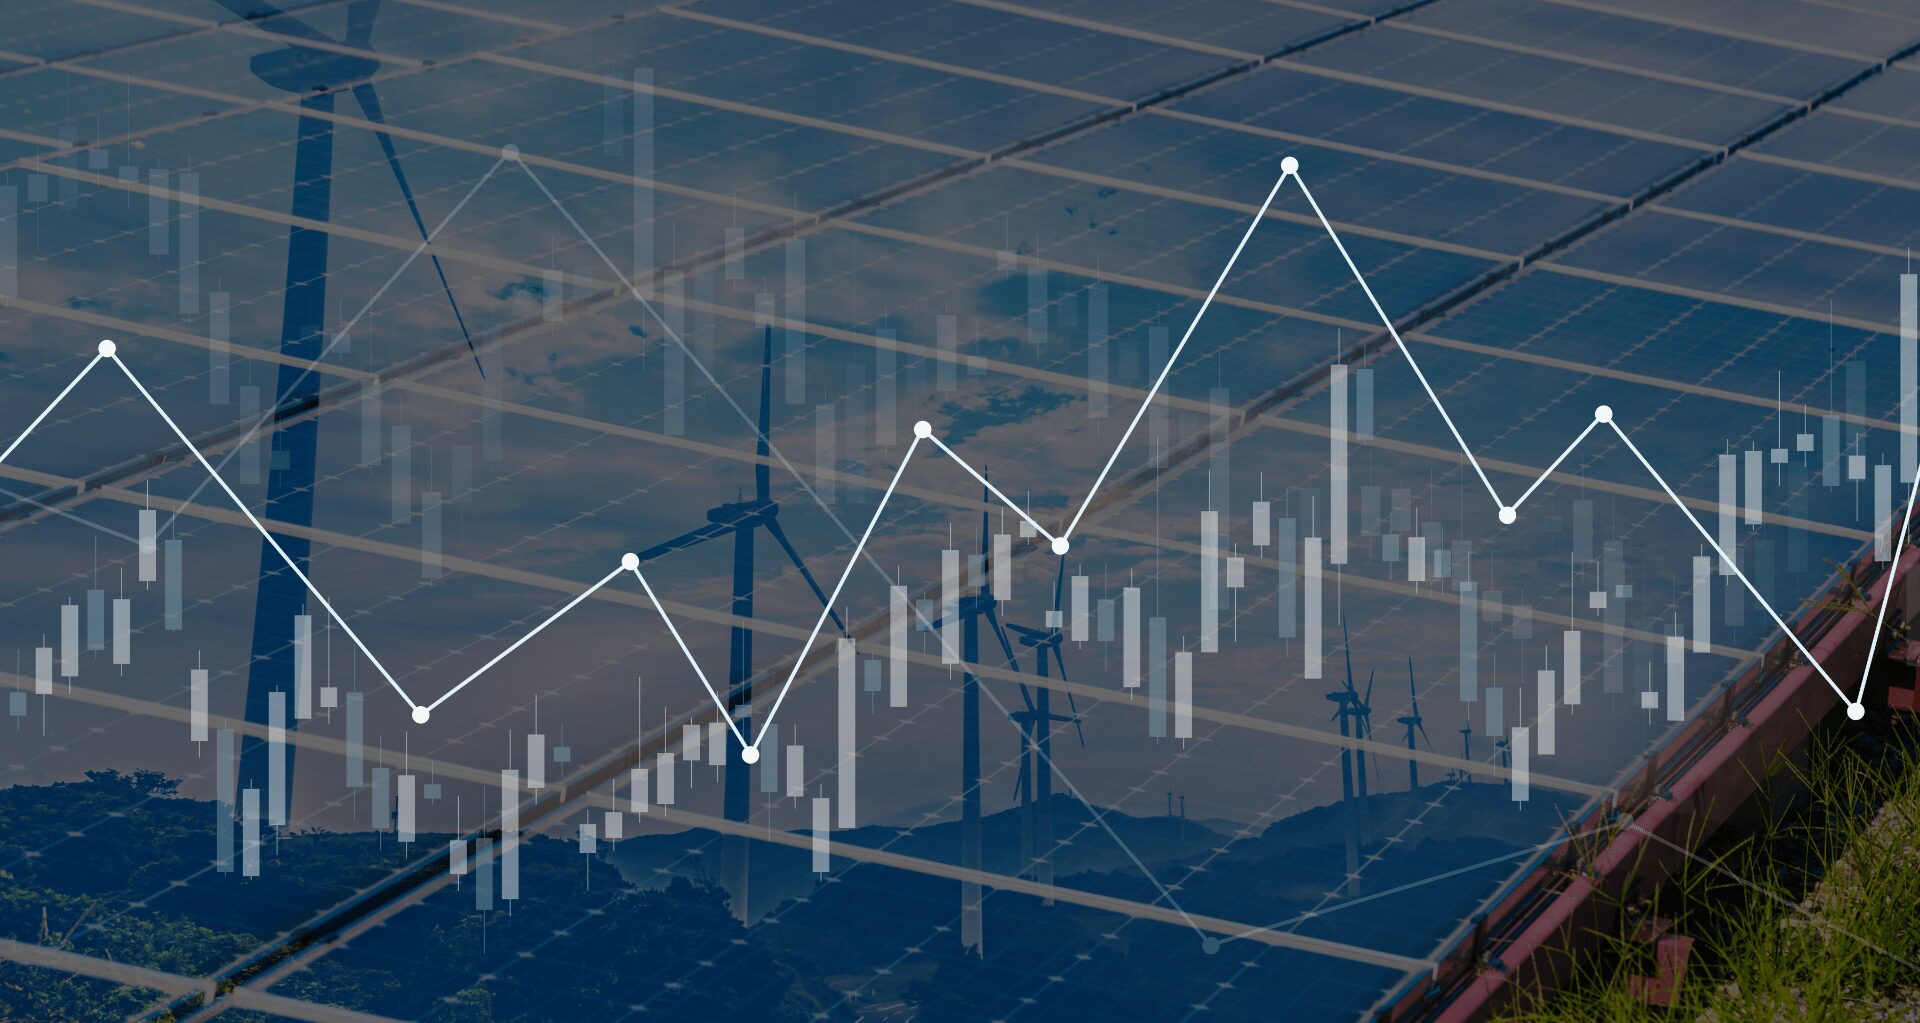
In the current uncertain political climate, securing reliable income is becoming essential. Our analysis tools help to optimise the output of PV power stations.
What is Energysoft’s Analytics module?
Energysoft’s Analytics module is an advanced data analysis tool designed to identify, characterise and explain the underperformance of photovoltaic power plants.
Its objective is not only to detect that a site is not producing enough, but above all to answer the key question:
Why is a site underperforming?
Analytics thus enables you to:
- Detect configuration faults
- Identify and quantify production losses
- Understand their physical, technical or operational origin
- Help operators make targeted corrective decisions.
What does the Analytics module consist of?
Analytics is structured around three complementary sub-modules:
1. Site configuration
This allows you to verify that the information entered into Energysoft (orientation, inclination, power, equipment distribution, loss coefficients, etc.) is consistent with what is actually measured.
2. The cascade of losses
This allows the various production losses between theoretical expected production and actual measured production to be identified and characterised.
3. The analysis report
It provides a set of figures and visualisations that enable diagnostics to be validated, faults to be detected (shading, fouling, degradation, etc.) and results to be presented in a readable format.
The value of analytics for operators
What exactly is Analytics used for?
Analytics allows you to:
- Identify underperforming sites
- Identify faulty components (inverters, solar fields, MPPT, etc.)
- And, above all, understand the cause of losses: incorrect configuration, hardware failure, fouling, shading, degradation, snow, etc.
In this way, an underperformance observation is transformed into an actionable diagnosis.
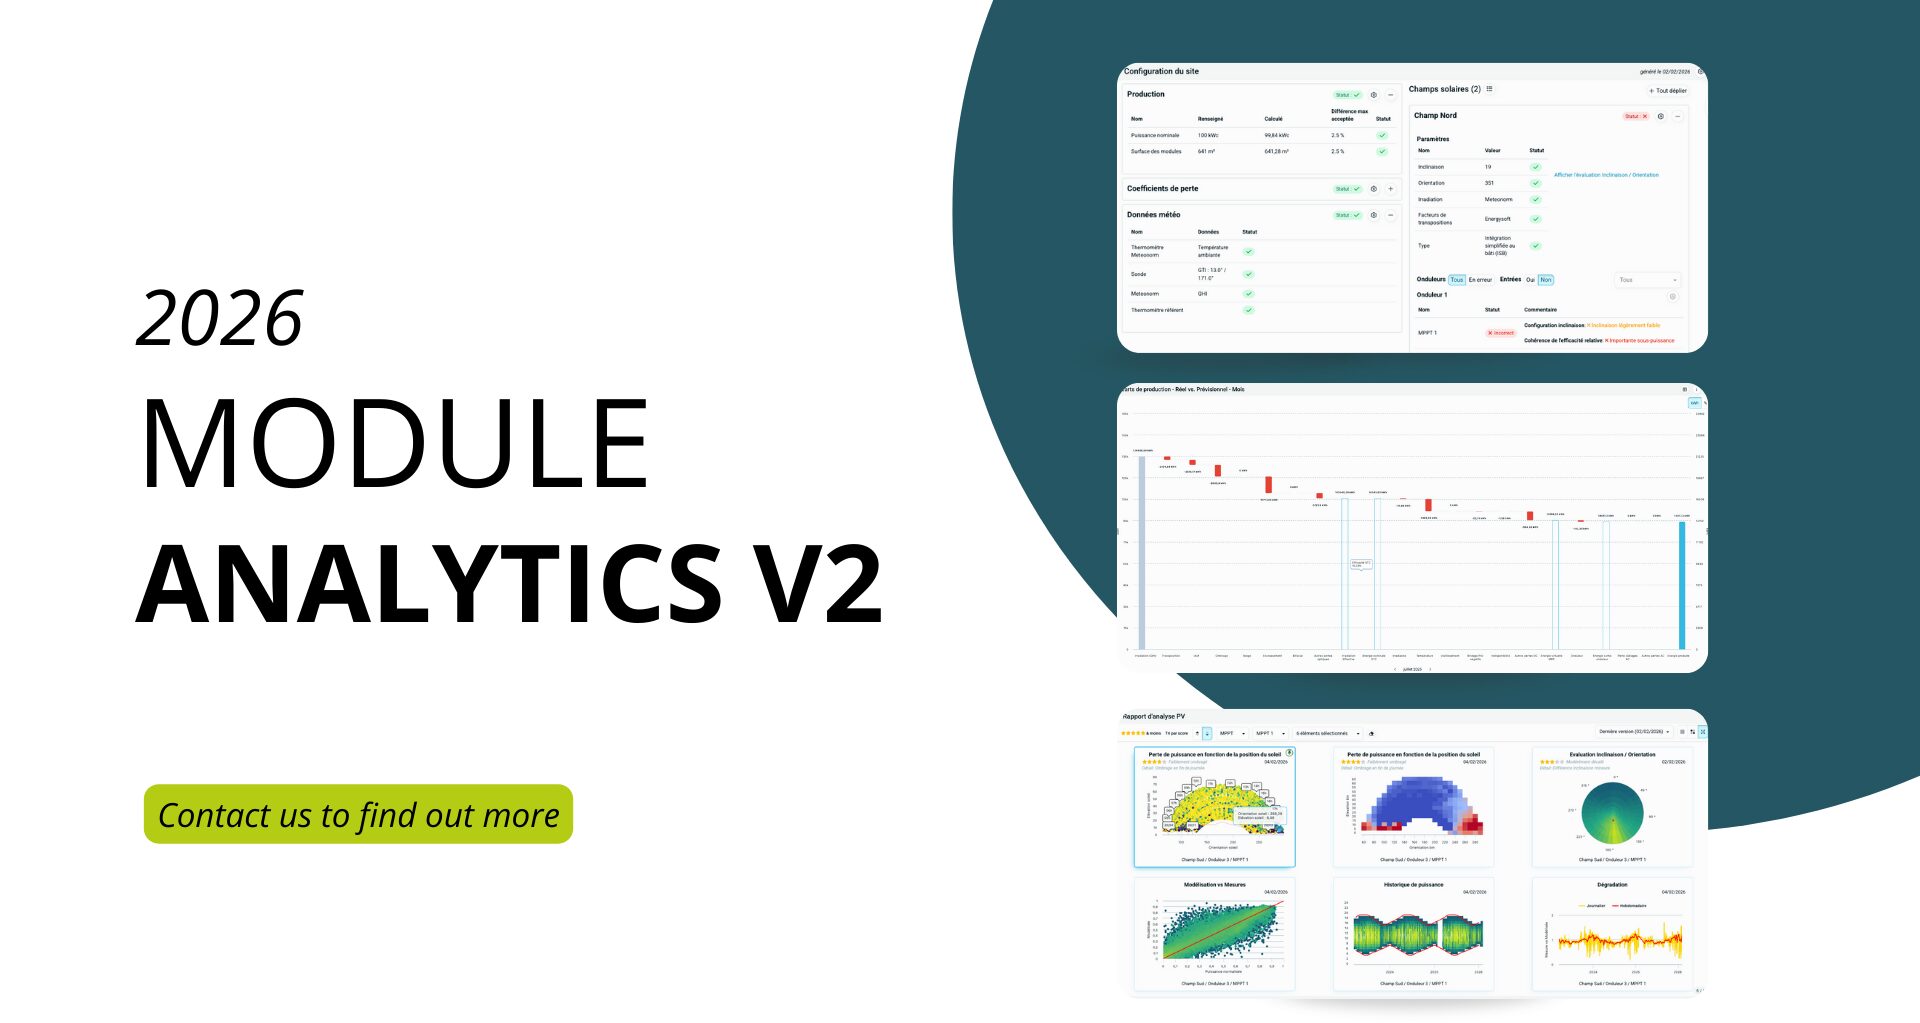
Analytics V2: what exactly has changed?
Version V2 brings major improvements to all aspects of the module: algorithm precision, enhanced functionality and improved usability.
1/ Detailed navigation by site and equipment
The cascade now clearly distinguishes between pvsyst losses (from the theoretical model) and actual losses (from field measurements).
The number of loss categories has increased from 10 to 16, allowing for a more detailed characterisation of the causes of underperformance.
Each loss brick is now interactive: the multi-site view provides access to details by site, and the single-site view provides access to details by inverter.
Top/flop views are also available, allowing you to immediately identify the best and worst performing installations or equipment.
The algorithms have been enhanced and validated to reduce false positives and improve the robustness of diagnostics.
2/ A smarter site configuration
Le module Configuration permet désormais de détecter automatiquement des incohérences entre ce qui est The Configuration module now automatically detects inconsistencies between what is declared in Energysoft (power, orientation, tilt, distribution) and what is actually measured.
For example:
- A declared power output that is inconsistent with the measured output.
- A declared south orientation when the data indicates south-east.
- Poor distribution of modules across the MPPTs.
Faults are detected more effectively and with clearer and more actionable messages.
3/ Enhanced, multi-level analysis reports
The analysis reports are a visual representation of the algorithms used in the other two modules. The major new feature is the extension of the reporting level: MPPT, inverters, solar field and site. This provides both a very detailed analysis when necessary and an aggregated overview for managing a portfolio of sites.
4/ A reinforced digital twin
The physical model of the power plant has been improved to take into account more technologies, including specific technologies such as CdTe, enhancing the accuracy of calculations and diagnostics and enabling operation without a learning period.
To continue
Other new features are currently being developed, such as weather diagnostics (e.g. snowfall) and an interface with the automatic Word/PDF report generation module.
With its customisable views, the Analytics module can be used for a variety of purposes, including operations, maintenance and portfolio management.